HttpLink
*** PLEASE NOTE THAT DOMOTICZ SUPPORTS DATA PUSH TO INFLUXDB NATIVALY NOW, SEE PAGE InfluxDB ***
Introduction
HttpLink uses the a http(s) stream to push data from Domoticz devices to a server accepting http requests (GET, POST, PUT). The function can be accessed from the setup menu: setup > more options > data push > HTTP.
The screen has three areas:
- Top part listing the selected devices or variables
- Left part is for setting individual links to the selected devices or variables.
- Right part is the general setting to reach the external http(s) server application and push the data;
Setup a link by filling out the left part of the screen. Select the device you want to push from the device name dropdown. Next select the value you wish to send from the dropdown. Most switches only have a value "Status" which will send the state of the device, e.g. "On", "Off" or the dim level. The same goes for security devices. Most sensors store multiple values; a weather sensor can supply temperature, humidity, barometer, etc.
Next select the link type: "global variable", "virtual device". Depending on the choice the next options will change; for a global variable enter the target variable name, for a virtual device enter the target id and property name. The device/scene id can be found in the url when you click on the virtual device or scene in the home center interface.
Set the link active and save it.
Every time a device that has an active link changes state or values in Domoticz, the link software finds matching device id's in the HttpLink table, and the value(s) will be pushed to the http server.
General Settings (Server parameters) :
- URL : The URL of the server
- Method : HTTP method (GET, POST or PUT)
- Authentication : HTTP authentication (None, Basic)
- Login : Login used by the BASIC authentication
- Password : Password used by the BASIC authentication
- Data : Sent data (POST or PUT) Example: [{"name":"device_%V","columns":["time","val"],"points":[[%t3,%v]]}]
- Headers: HTTP header data
Keywords :
When specifying the URL and the Data, it's possible to use some keywords that will be replaced by device data when the device is triggered. Here is the list of keywords :
- %v : Value
- %t0 : Timestamp (epoc time in seconds, local time)
- %t1 : Timestamp (epoc time in ms, local time)
- %t2 : Timestamp (epoc time in seconds, UTC)
- %t3 : Timestamp (epoc time in ms UTC)
- %t4 : Timestamp (RFC 3339 format, "YYYY-MM-DDThh:mm:ssZ"
- %D : Target Device id
- %V : Target Variable
- %u : Unit
- %n : Device name
- %T0 : Device type
- %T1 : Device subtype
- %h : hostname
Note to Virtual / Dummy sensors: If the HTTP link or MQTT is not sending any values to the database, check the update method of your virtual sensors in your scripts. If using the ['UpdateDevice'] method, you will directly write the value to the internal database without triggering an HTTPlink or MQTT update for this sensor. Better is to use the JSON API of Domoticz and update your virtual sensors this way.
Example
Here is a complete example of integration with 2 others products (InfluxDB (http://influxdb.com/) & Grafana (http://grafana.org/)) on a Debian server
*** PLEASE NOTE THAT DOMOTICZ SUPPORTS INFLUXDB NATIVALY NOW, SEE PAGE InfluxDB ***
- Installing InfluxDB 0.8
- InfluxDB is a Time Series Database which is table to stored timestamped data in a clustered environment using shards spaces
- To install InfluxDB (see http://influxdb.com/download/), execute the following commands : wget https://s3.amazonaws.com/influxdb/influxdb_latest_amd64.deb ; dpkg -i influxdb_latest_amd64.deb
- Start InfluxDB with : /etc/init.d/influxdb start
- Connect to the database with your browser to the address http://<server ip>:8083
- Click on Connect and enter the default credentials (root/root)
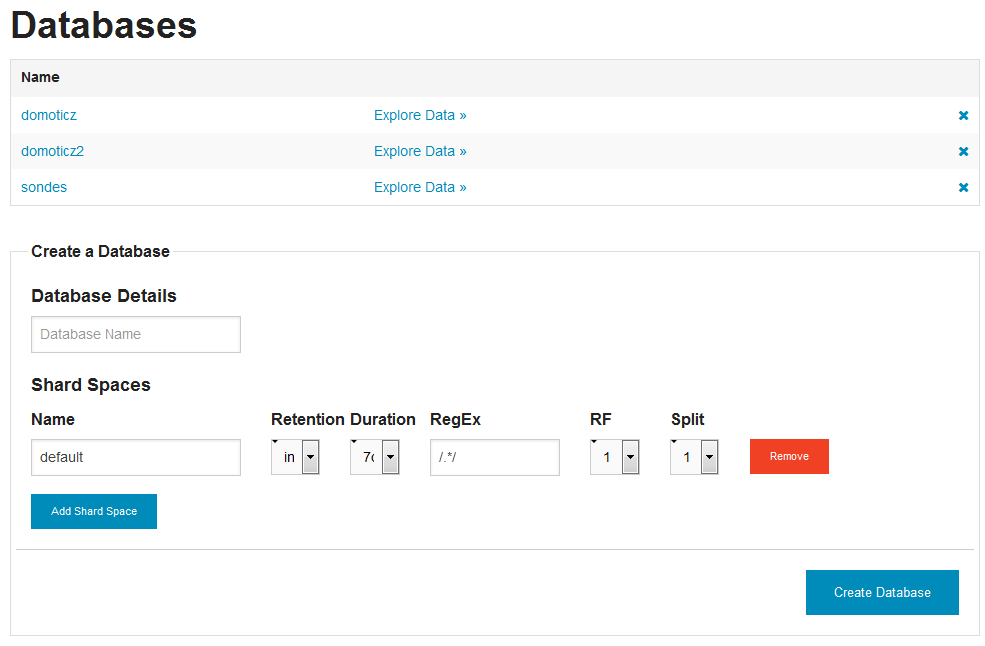
- Create a database called "domoticz"
- Configuring Domoticz
- Configure the HTTP datapush as followed :
- URL : http://<server ip>:8086/db/domoticz/series?u=root&p=root : The url is the entry point to write data into the database
- Method : POST
- Authentication : None
- Data : [{"name":"device_%V","columns":["time","val"],"points":[[%t3,%v]]}] : The data are stored into one table per device (called device_<variable>) and the timestamp are epoc
- To check if data are pushed to InfluxDB :
- Go back the your browser on http://<server ip>:8083
- Select Databases
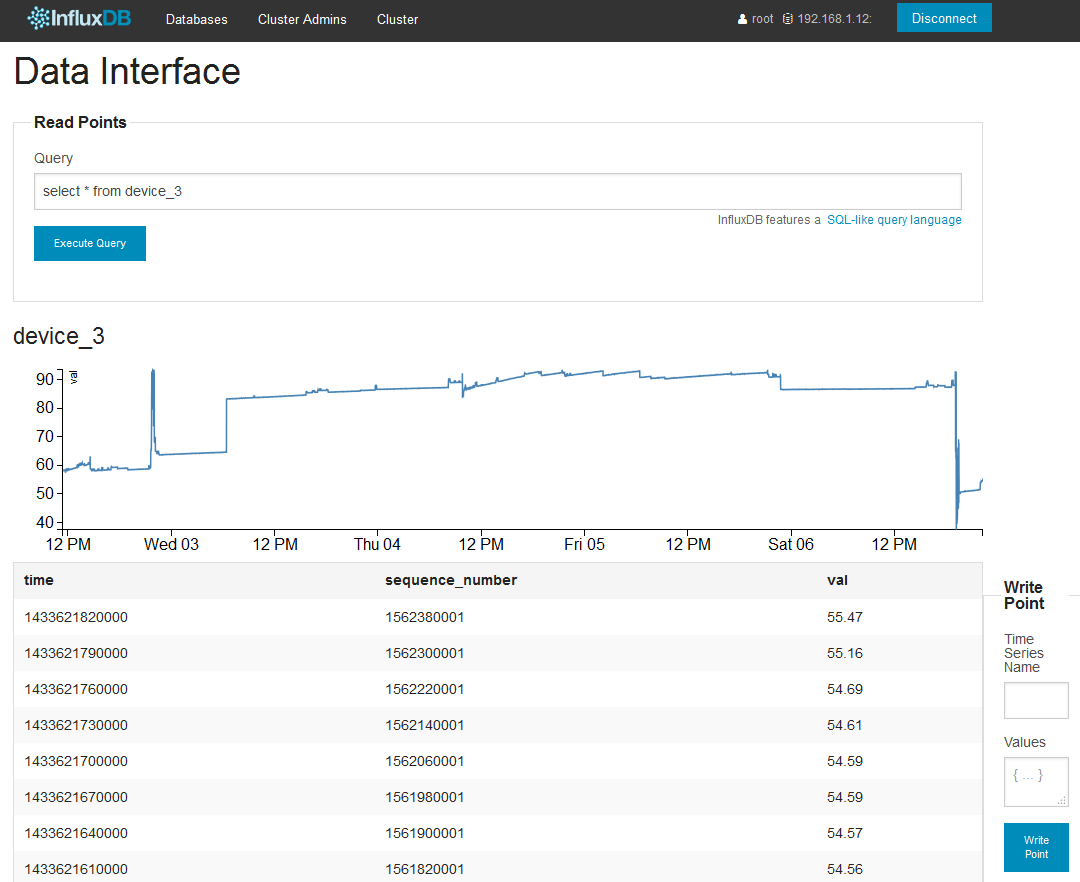
- Click on "Explore Data"
- Enter an SQL-like query to list the data : SELECT * from device_1 (if the variable is 1)
- You should get some points displayed
- Configure the HTTP datapush as followed :
- Installing Grafana 2.0.2 : Grafana is an open source, feature rich metrics dashboard and graph editor for Graphite, InfluxDB & OpenTSDB
- To install Grafana (see http://docs.grafana.org/installation/debian/), execute the following commands : wget https://grafanarel.s3.amazonaws.com/builds/grafana_2.0.2_amd64.deb ; apt-get install -y adduser libfontconfig ; dpkg -i grafana_2.0.2_amd64.deb
- Start Grafana with : /etc/init.d/grafana-server start
- Connect to the Grafana server with your browser to the address http://<server ip>:3000
- Click on Login with the default credentials (admin/admin)
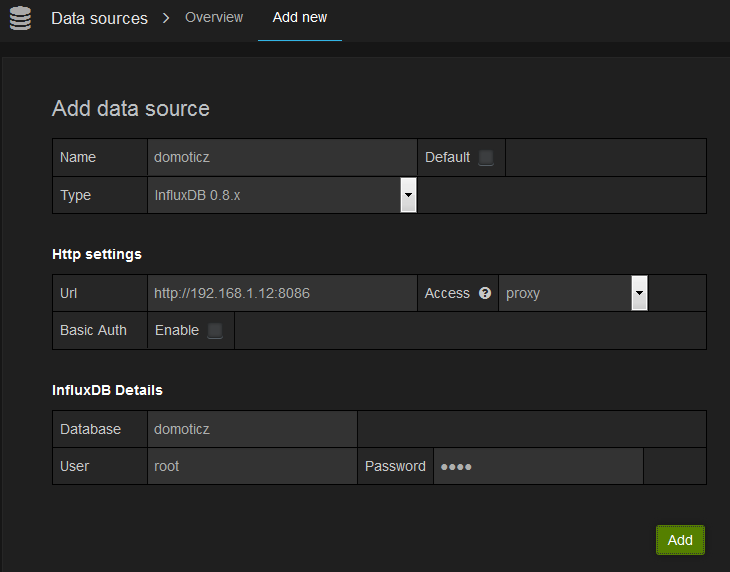
- Create a datasource :
- Go back to the dashboard and create a new one
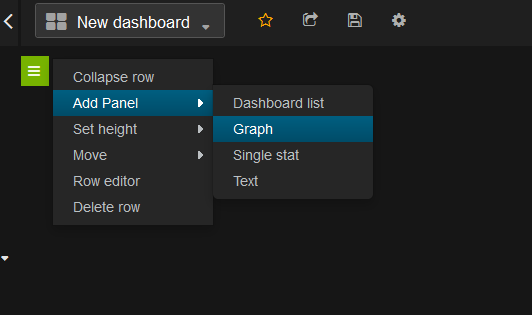
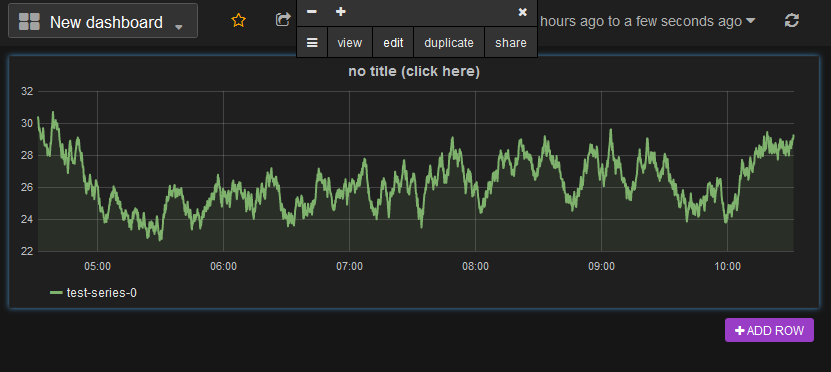
- Add a graph by click on the green square on the left
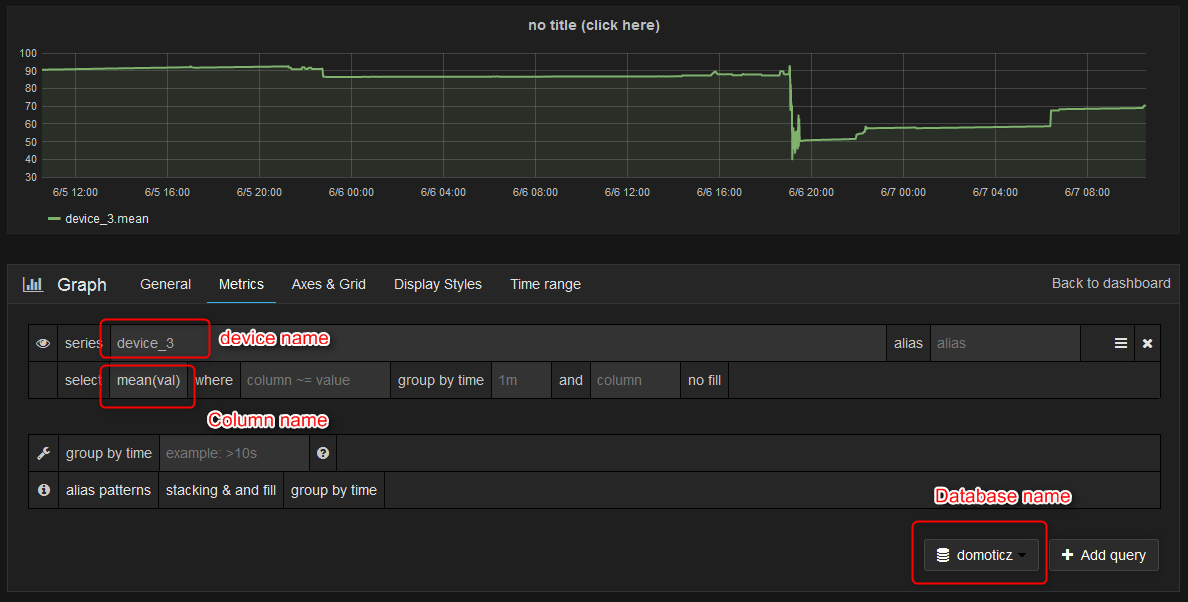
- Edit the graph by clicking on its title, then on "edit"
- Enter the device name in the series line
- Enter the column name in libe just below
- You data should be displayed !
Note for InfluxDB 0.9 : This new version add new API & entry points to write data. Here are a method to insert data
- Url : http://<server ip>:8086/write?db=domoticz&u=root&p=root&precision=ms
- Method : POST
- Data : device_%V value=%v %t3

